The global lockdown caused by the COVID-19 had an extreme effect on daily carbon emissions and has raised international researchers’ interest. Among them, two international teams have come to the same conclusion: carbon emissions fell by more than one billion tons in the first four months of the year compared with the same period in 2019. These two international teams are led by Corinne Le Quéré and Philippe Ciais, two researchers involved in the VERIFY project.
The first study is summarized in a recent paper in Nature Climate Change: https://www.nature.com/articles/s41558-020-0797-x
The second study (in press) led to a News in Nature: https://www.nature.com/articles/d41586-020-01497-0
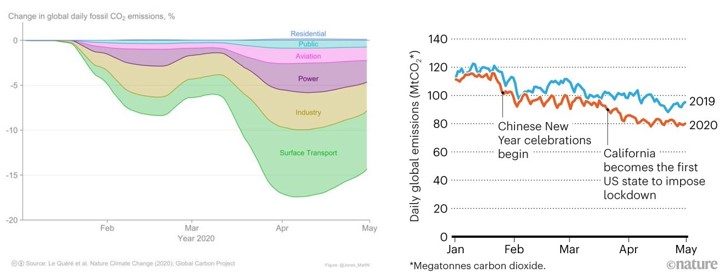
Figure 1 : Daily global emissions of CO2 during the first months of the 2020 year in different sectors (left picture, from Le Quéré et al, Nature Climate Change (2020)) and compared to the 2019 year (right picture from Liu et al, in press (2020))
Le Quéré’s team has compiled information on daily activity data from different sectors between January and April 2020 in 69 countries, which represent 85% of the world’s population and 97% of global CO2 emissions and then inferred associated changes in emissions using the confinement measures taken by governments to control the spread of coronavirus as an interpolation matrix.
On the basis that these measures will be relaxed over the course of this year, the team projected that the cumulative global emissions for 2020 could drop by anything from 4–7%, depending on whether pre-pandemic activity will return by mid-June or if some measures will remain in place until the end of the year. The full range of uncertainties spans 2-13%, including uncertainties in the data.
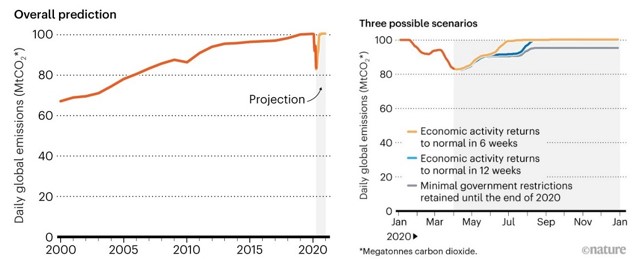
Figure 2 : Daily global emissions of CO2 over the years and the projection for the months to come. Source: Le Quéré et al, Nature Climate Change (2020)
In a parallel effort, Philippe Ciais’s team is building a prototype system monitoring daily emissions at the scale of 130 countries. They analysed hourly electricity energy data, hourly traffic data from more than 400 cities, all aircraft flights data, natural gas consumption from pipeline operators in Europe, and industry monthly indices with detailed sectorial information for India and China, including cement emissions as well as weather data across the globe to produce daily estimates of carbon emissions for 2019 and 2020. According to their preliminary estimates, global emissions started to significantly diverge from last year’s in March, as countries around the world began shutting down businesses and enforcing social-distancing measures, and recovery seemed to have happened in China by April.
This team has launched the Carbon Monitor web site https://carbonmonitor.org which give access to graphicsc and data to daily CO2 emissions worldwide, that will be regularly updated.
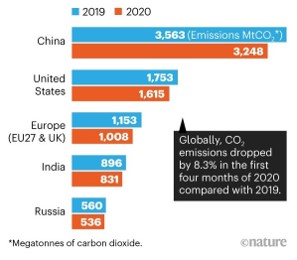
Figure 3 : Global emissions of CO2 in different countries in 2019 and 2020. Source Liu et al, in press (2020)
These two studies show that the scale of the reduction in emissions this year could be similar to the annual emissions reductions that would be required in order to meet the objectives of the 2015 Paris climate agreement, which seeks to limit global warming to 1.5 to 2°C above preindustrial levels.
This can be set in motion if governments and local leaders align their economic stimulus in response to the Covid-19 crisis with the low-carbon agenda, because this will provide the structural changes needed to sustain permanent decreases in emissions.