File : D2.12
Author : Audrey Fortems-Cheiney and Grégoire Broquet (CEA/LSCE)
This deliverable presents an update of the atmospheric inversions presented in D2.11. It aims at quantifying monthly to annual budgets of the national emissions of FFCO2 in Europe over more than a decade. These FFCO2 emission estimates are based on the assimilation of the long-term series of NO2 OMI space-borne observations with the new Community Inversion Framework (CIF) and the CHIMERE regional chemistry-transport model. The new set of NOx inversions covers the period 2005 to 2020. In addition to a temporal extension of the previous analysis, the update includes the use of the newly released TNO-GHGco-v3 inventory instead of the TNO-GHGco-v2 inventory 1) as a prior estimate of the NOx anthropogenic emissions in the NOx variational inversions assimilating OMI NO2 data that corresponds to the first step of the approach, 2) to derive the anthropogenic NOx to FFCO2 emission ratios that are used to derive the FFCO2 emissions in the second step of the approach. The principle of this two-step approach is briefly reminded.
As in D2.11, results mainly indicate an increase of the estimates of anthropogenic NOx emissions by the inversion compared to the inventory (here TNO-GHGco-v3). As an example, the annual budget of European NOx anthropogenic emissions is increased by about 3% compared to the TNO-GHGco-v3 inventory in 2015. This correction is slightly lower than that applied to the TNO-GHgco-v2 inventory in D2.11. Overall, all the prior and posterior NOx anthropogenic emissions presented in D2.11 and D2.12 are very close. As a natural consequence of the increase of the NOx emissions by the inversion and of the use of the emission ratios from the inventory, the inverted FFCO2 emissions from the NOx inversions are larger than those from the TNO-GHGco-v3 inventory, and the differences between these inverted emissions and the inventory are relatively low (below 5% for all annual budgets at European scale). This could be seen as a positive sign of consistency for the years 2005 to 2019. However, the lack of decrease of both the NOx and NO2 based FFCO2 inversion estimate when compared to the inventory for the year 2020 raise concerns since the extrapolation of the TNO-GHGco-v3 inventory for the year 2020 likely significantly underestimates the decrease of the emissions due to the covid-19 crisis (see the explanations and analysis in D2.6).
This deliverable also documents a first attempt at using CO MOPITT data to strengthen the estimate of the monthly to annual scale budgets of the national FFCO2 emissions, following a two-step approach similar to that when assimilating NO2 data. It presents a 10-year inversion of the daily European CO emissions at 0.5° resolution for the period 2011-2020 using the TNO-GHGco-v3 inventory as the prior knowledge on these emissions and the CO MOPITT data. Results mainly indicate a slight decrease of the estimates of anthropogenic CO emissions by the inversion compared to the TNO-GHGco-v3 inventory. When this inversion is used to rescale jointly the monthly budgets of sectoral CO and FFCO2 emissions from the inventory, it yields FFCO2 emissions that are smaller than those from the TNO-GHGco-v3 inventory. These differences are relatively weak at national and monthly scales, and the emissions derived from the CO inversion are quite consistent with the TNO-GHGco-v3 inventory, but their sign is opposed to those obtained when assimilating NO2 data. This demonstrates the need for a better understanding of the uncertainties, and in particular the potential sources of biases in the two inversion processes before attempting at synthesizing the CO and NO2-based estimates of the FFCO2 emissions. The previous conclusions from D2.10 and the analysis presented here provide more confidence in the FFCO2 estimates derived from the NOx inversions than from the CO inversions.
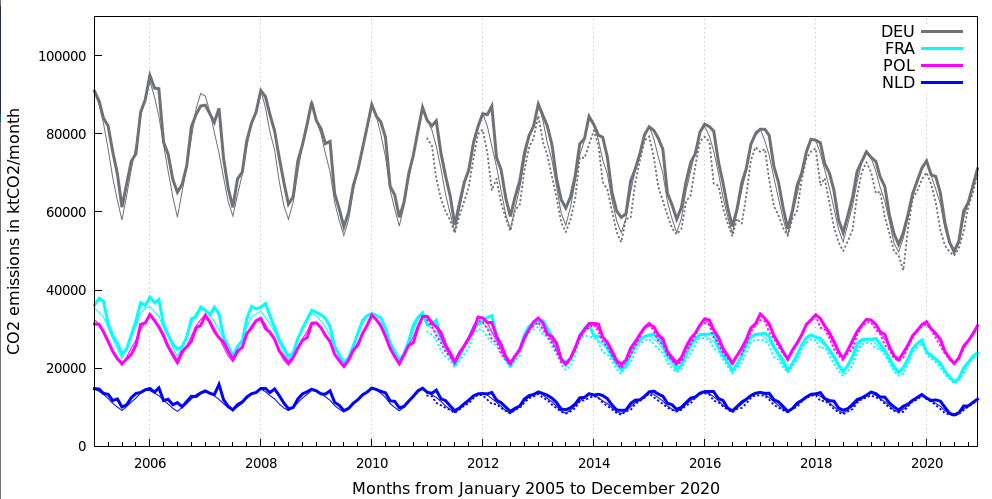
Figure 1 : Monthly estimates of German (in grey), French (in cyan), Polish (in magenta) and Dutch (in blue) FFCO2 emissions from the TNO-GHGco-v3 inventory (in thin line) and from the NOx inversions (in bold line), in ktCO2, from January 2005 to December 2020.Monthly estimates of FFCO2 emissions from the CO inversions are shown in dashed line from January 2011 to December 2020