File : D2.5
Author : Ingrid Super (TNO)
In a previous deliverable (D2.4) a first attempt was made to estimate emissions for the two most recent years for which country reports are not yet available. Here, we update our methodology by using activity data or proxies to better estimate the year-to-year variability in emissions per source sector. We estimate emissions for 2018 and 2019, but also for 2016 and 2017 using the same methodology for comparison with reported emissions. We start with the most dominant source sectors and found good activity data for most of them, although often these data are not yet available for 2019. In the testing for 2016 and 2017, the emissions estimates generally approximate the reported emissions for 2016 and 2017 satisfactorily . However, especially CO can sometimes show deviations because of the large variability and trend in its emission factors. For small countries (such as Malta) the implementation of new technologies can have a large, sudden impact on the emissions that is difficult to take into account. Therefore, (very) small countries show the largest deviations. However, their impact on the total emissions is limited and overall the presented methodology gives a good first estimate of the emissions for recent years. Further effort will be made to include additional source sectors in a next update (D2.6).
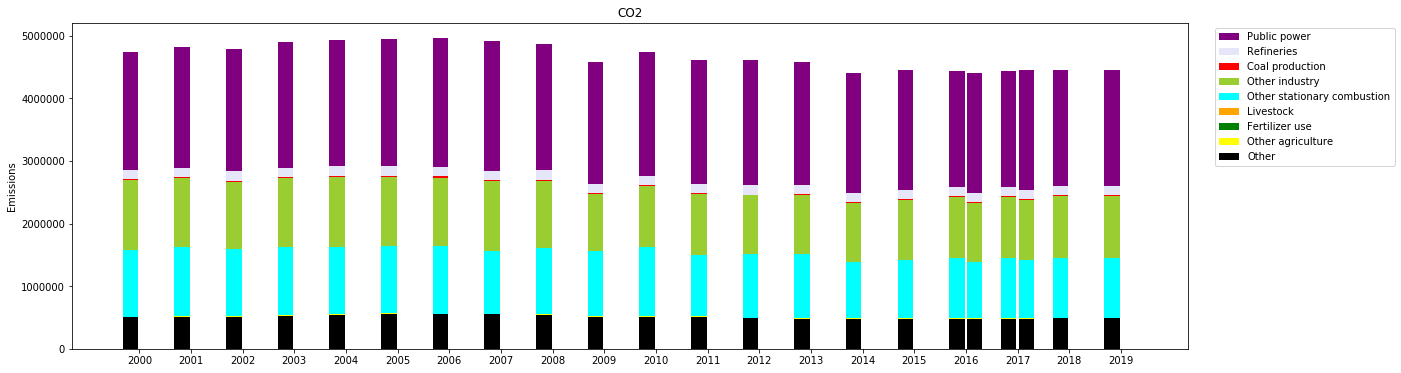
Figure 1 : Time series of emissions of CO2 per source sector and summed for the whole domain. For years before 2016 emissions are reported; for 2016 and 2017 both the reported (right bars) and estimated (left bars) emissions are given; for 2018 and 2019 emissions are estimated