File : D2.7
Author : C. Jäschke (UHEI) et al.
In a metropolitan area located in South-Western Germany (Rhine valley), we have performed long-term measurements of CO, CO2, NOx, NO2, and 14CO2 using in-situ and remote sensing techniques. We investigated the atmospheric ratios of the in-situ proxy enhancements ΔCO/ΔffCO2 and ΔNOx/ΔffCO2 as well as the total in-situ enhancements ΔCO/ΔCO2 and ΔNO2/ΔCO2. Corresponding ratios of column-averaged abundances (ΔXCO/ΔXCO2 and ΔNO2, col/ΔCO2) were derived from the remote sensing measurements and compared to the in-situ results. The range of proxy ratios determined for the total CO2 enhancements agree between the in-situ and the total column observations. However, we can show significant changes in the in-situ proxy ratios when compared to ΔffCO2 instead of total ΔCO2 enhancements, highlighting the presence of non-fossil ΔCO2 components. The in-situ Δproxy/ΔffCO2 ratios are compatible with the assumption of a variable mix of different source sectors, assuming the TNO emissions ratios for each source sector. No clear seasonal or diurnal change of the proxy ratios (e.g. between heating and warm season) was found. This is because the spatial heterogeneity of the ffCO2 sources around the KIT station causes more variations in the proxy ratios than their temporal changes. Simultaneous measurements of CO, NOx and 14CO2 provide three independent observables that might allow separating the ffCO2 enhancements in the three main contributing sectors: industry, traffic and residential heating.
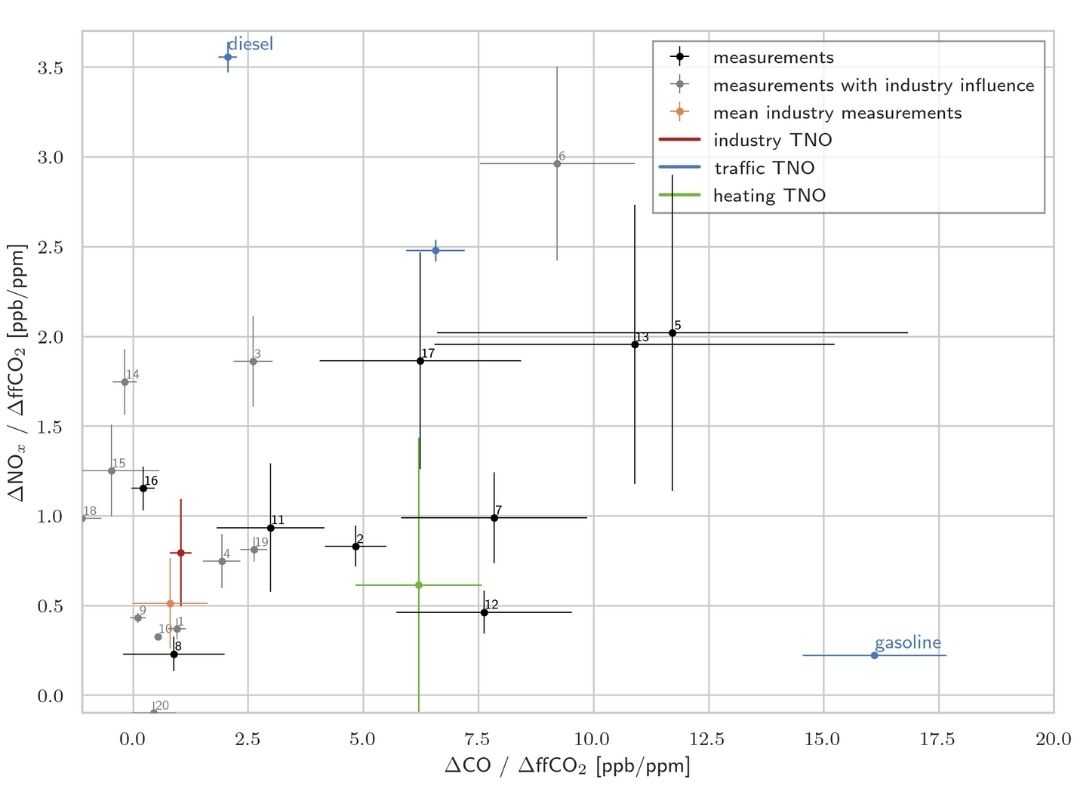
Figure 1 : ∆NOx/∆ffCO2 ratios plotted over ∆CO/∆ffCO2 ratios. In black, the atmospheric in-situ ratios of the flask measurements are shown, in grey ratios influenced by the industry emission sector. The orange dot shows the error weighted mean of the industry influenced in-situ ratios. The coloured dots denote inventory-based emission ratios for the three sectors industry (red) , traffic (blue) and heating (green) obtained from TNO for the year 2019 from a region of approximately 45 km x 35 km around the KIT tower. The averaged industry ratio is the mean of all sources from TNO sectors A and B, the traffic is further split into values for diesel, gasoline and the mix of all fuel types.