File : D6.8
Author : Matthew McGrath et al.
The VERIFY project currently stores 1800 GB of data, including 71 GB of output fluxes. This is expected to grow over the final two years of the project, as more groups take advantage of high-resolution forcing data provided by the project. In order to share this data among partners, a series of mechanisms were put in place, focused on a dedicated data server that allows users to download any dataset. The data is separated by input and output data and by primary chemical species to allow easier access. Additional services were placed on top of this server, permitting users to browse and visualize the various datasets without downloading it. Extensive work has gone into harmonizing both the input and the output datasets in terms of file formats, grids, variable names, variable units, and aggregating spatial products into time series by country/region. This work enabled the creation of three distinct tools to manipulate the data. The first is for advanced scientific users, and helps them personalize plots. The second is for regular scientific users, and helps them explore time series in a user-friendly manner. The third allows policy-makers to view a set of already-completed plots summarizing the results of all countries and multiple regions; these plots were created in coordination with WP5 for use in the annual synthesis paper and with WP1 for use in the country summary Fact Sheets.
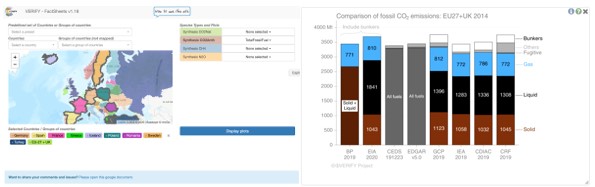
Figure 1 : Illustration of the GHG synthesis plot facility